- 153 -
Ⅷ.
주택 ·
건설
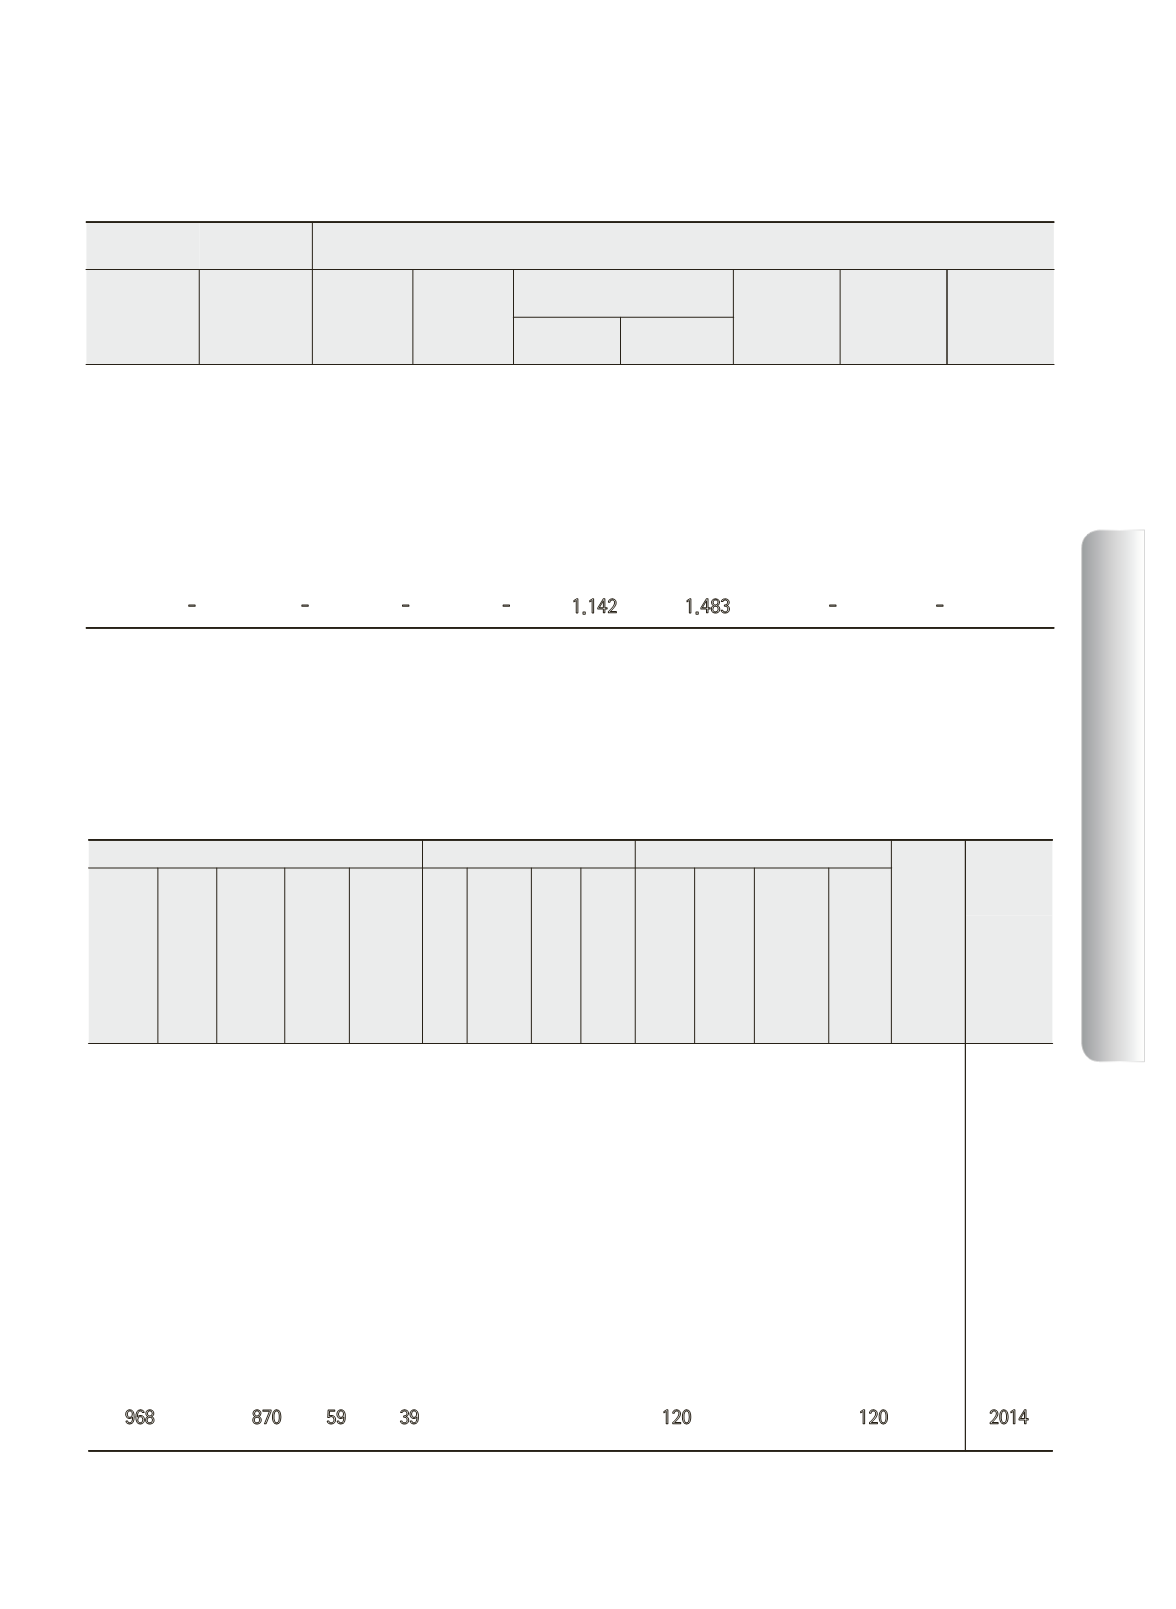
Land Price Changing Rate
Unit : %
이 용 상 황 별 By usage condition
생 산 관 리
Production
management
계 획 관 리
Planning
management
전
Dry paddy
답
Rice paddy
대
임야
Forest
field
공장
Factory
site
기타
Others
주거용
Residential
상업용
Commercial
-
-
-
-
1.719
0.261
-
-
-
-
-
-
-
0.586
0.206
-
-
-
-
-
-
-
1.013
0.896
-
-
-
-
-
-
-
-0.852
2.596
-
-
-
-
-
-
-
0.504
0.213
-
-
-
-
-
-
-
1.142
1.483
-
-
-
Source : Korea Land Housing Corporation land price trend (
)
「The investigation into the change in national land price」
Note : 1) Land price change is the change in price when the price of standard year (Sept. 2010) is set at 100
Specific Use Area
Unit : person, 1,000㎡
상업지역 Commercial zone
공업지역 Industrial zone 녹지지역 Green zone
미지정
Undesig
nated
소계
Sub
Total
중심
Cen-
tral
일반
Gen-
eral
근린
Neigh-
bor
hood
유통
Distribu-
tional
소계
Sub
Total
전용
Exclu-
sive
일반
Gen-
eral
준공업
Mix-
ed
소계
Sub
Total
보전
Pre-
served
생산
Agricul-
tural
자연
Natural
955
- 857 59
39 -
-
-
- 120
-
- 120
- 2009
955
- 857 59
39 -
-
-
- 120
-
- 120
- 2010
955
- 857 59
39 -
-
-
- 120
-
- 120
- 2011
973
- 875 59
39 -
-
-
- 120
-
- 120
- 2012
973
- 875 59
39 -
-
-
- 120
-
- 120
- 2013
968
-
870 59
39
-
-
-
-
120
-
-
120
- 2014
Source : Urban Planning Division in Seoul City


